There are many misconceptions when it comes to Security Operations as to what it really is, and most companies don’t actually know why they’re doing what they’re doing, which makes it even harder to know how well you’re really doing.
Introduction
In the fast-paced world of cyber security, knowing how well your Security Operations Centre (SOC) is performing can be tricky. You’re dealing with the flood of alerts, constant threats, and the need to respond quickly. But how do you measure success in such a complex and variable environment? The answer lies in defining and tracking the right Key Performance Indicators (KPIs).
KPIs give you a clear picture of how your SOC is performing – not just in identifying threats, but in overall operational effectiveness and efficiency (business as usual). In this post, we’ll dive into some of the most critical KPIs for SOCs, and how you can use Microsoft tools like Sentinel and Defender to stay on top of them.
Why KPIs Matter in Your SOC
Security Strategy Alignment with Business Strategy
At the end of the day, your SOC doesn’t exist in a vacuum. It’s there to protect the business, and its success should be measured by how well it does that. Think of KPIs as a way to link the work your SOC does to the “bigger picture” for the business. For example, reducing your Mean Time to Respond (MTTR) means not only responding to threats faster but potentially preventing downtime or costly data breaches.
This alignment ensures that the SOC isn’t just focused on handling incidents but is also contributing to broader business objectives.
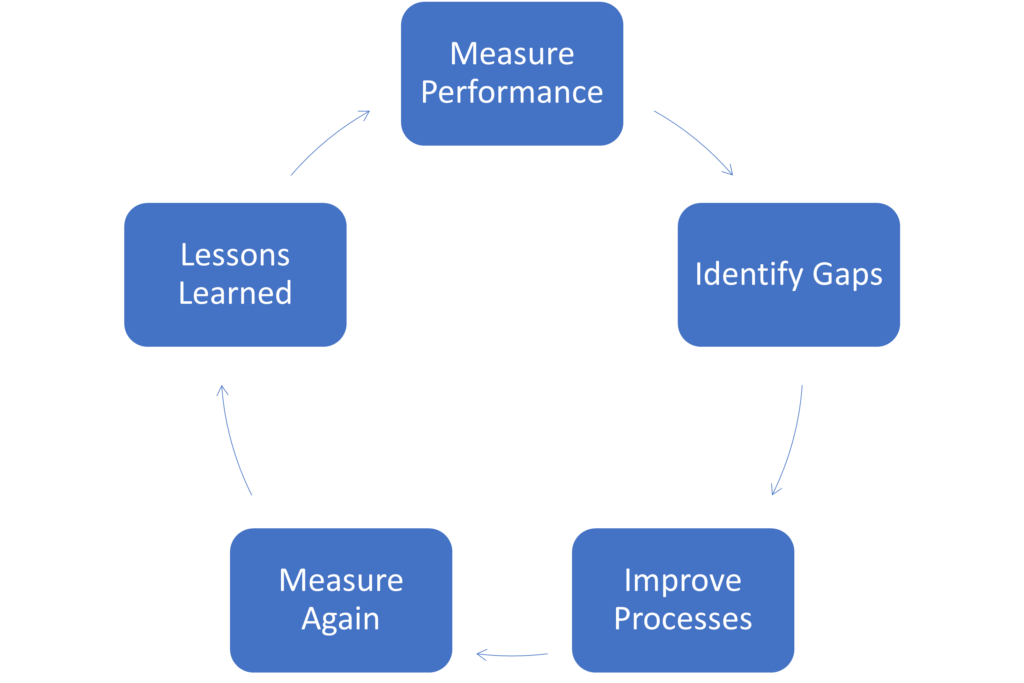
Encouraging Continuous Improvement
KPIs aren’t just about tracking performance, they’re also about improvement. When you regularly measure things like detection rates or how quickly your team responds to threats, it becomes easier to spot areas for improvement. Identifying these trends means you can focus training or resources where they’re needed most. Think of KPIs as your guide for refining processes and tools, ensuring your SOC is always moving forward.
The Metric‑Rate Principle
A useful KPI is useless if you sample it at the wrong frequency. The metric‑rate principle says the sampling window should match the speed of the OODA loop (Observe‑Orient‑Decide‑Act). For example, if incidents cluster in a two‑hour burst, a 30‑day average will hide that urgency. Adjust your aggregation window (hourly, daily, weekly) to match the threat tempo.
The SOC-Process Decomposed – Where Metrics Live
| SOC Phase | Example KPIs | What It Tells You |
| Collection | Source‑Data Coverage – % of logs actually forwarded to SIEM | Guarantees high‑quality inputs; missing data is the first reason for long MTTD |
| Detection | False‑Positive/True‑Positive Ratio – per source or per analyst | Keeps analysts focused and reduces alert fatigue Identifies rule quality issues and areas for improvement |
| Triage | Avg. Triage Time – time from first activity to analyst‑created incident | Measures analyst efficiency and workload balance |
| Containment / Recovery | Incident Categorisation (e.g. VERIS, CERT taxonomy) – % of incidents per category | Enables risk‑based prioritisation and clearer reporting |
| Automation | SOAR Playbook Coverage – % of incidents that trigger an automated playbook | Drives faster triage and containment |
| Metric‑Rate | Matching aggregation window to incident cadence | Exposes real trends without smearing spikes |
Some Key (and Generic) SOC Success Metrics and KPIs
Mean Time to Detect (MTTD)
This measures how long it takes for your SOC to detect a potential threat. The faster you can spot something suspicious, the better your chances of stopping it before it causes real damage. But improving MTTD isn’t just about faster alerts, it’s about having the right threat-led detection capabilities in place.
Mean Time to Respond (MTTR)
MTTR is the next logical step: once a threat is detected, how quickly can your team respond and remediate it? A fast MTTR means less time for attackers to be left unhindered, which is crucial in limiting the impact of an incident. Resources such as automation tools, like Playbooks in Microsoft Sentinel, a well-structured knowledge-base, and targeted education can drastically improve response times by taking immediate actions on well-known threats.
False Positive/Negative Rates
No one wants their SOC analysts drowning in false positives, or worse, missing real threats due to a weak detection strategy/alert fatigue. Monitoring your false positive and false negative rates helps you fine-tune your detection rules and thresholds, so you’re only responding to real risks. Adopting a threat-led detection strategy can drastically reduce the likelihood of this occurring.
Automation Utilisation
The more you can automate repetitive tasks, the less time your team will spend on manual processes, and the more time they can dedicate to more strategic activities. Measuring how much of your workflow is automated is a good KPI to ensure your SOC is running efficiently.
Analyst Case Handling Capacity
This KPI tracks how many cases each analyst handles, helping you balance workloads and identify if your team is stretched too thin. If one analyst is handling significantly more incidents than others, it may indicate a process bottleneck or training need. However, these KPIs can be heavily influenced by other real-world and human factors outside of expertise, ranging from neurodiversity to personal life issues.
How to Track SOC KPIs Using Microsoft Tools
Microsoft’s ecosystem, especially Sentinel and Defender, provides excellent built-in tools for monitoring and visualising your SOC’s KPIs. Here’s how to get started.
Setting Up Dashboards in Microsoft Sentinel
Microsoft Sentinel enables you to create custom dashboards that let you track everything from detection times to response efficiency. You can configure these dashboards to display metrics like MTTD and MTTR, giving you an instant snapshot of how your SOC is “performing” in real-time.
MTTD
let lookBack = 28d;
SecurityIncident
| where TimeGenerated >= ago(lookBack)
| summarize arg_max(LastModifiedTime, *) by IncidentNumber
| extend detectTime = datetime_diff("minute", CreatedTime, FirstActivityTime)
| summarize MTTD = avg(detectTime) by bin(TimeGenerated, 1d) //Feel free to amend the breakdown from hours, to days, to weeks, to months
//| summarize MTTD = avg(detectTime) by bin(TimeGenerated, 1d), Severity (recommend kind=unstacked on the render)
| render columnchart with(title=”Daily Mean Time To Detect”, ytitle=”MTTD (Minutes)”, xtitle=”Detection Date”)
MTTR
let lookBack = 28d;SecurityIncident
| where TimeGenerated >= ago(lookBack) and Status == "Closed"
| summarize arg_max(LastModifiedTime, *) by IncidentNumber
| extend respondTime = datetime_diff("minute", ClosedTime, CreatedTime)
| summarize MTTR = avg(respondTime) by bin(TimeGenerated, 1d) //Feel free to amend the breakdown from hours, to days, to weeks, to months
//| summarize MTTD = avg(detectTime) by bin(TimeGenerated, 1d), Severity (recommend kind=unstacked on the render)
| render columnchart with(title="Daily Mean Time To Resolve", ytitle="MTTR (Minutes)", xtitle="Closure Date")